Quick Answer: Use Welch's t-test when comparing two independent groups, especially when they have different variances or sample sizes. It's the safer, more robust default choice over Student's t-test.
Imagine two groups of students take the same exam. You want to know if one group did better than the other. A t-test is one of the go-to tools for comparing group averages.
But here's the catch: there's more than one type of t-test. The one you may have heard of first is the Student's t-test. The other, less famous but super useful, is Welch's t-test.
Most of the time, Welch's test is the safer choice — and in this article, we'll explain why in plain English.
1. The Classic Student's t-Test (and Its Assumptions)
The Student's t-test is like a recipe that works only if you follow the instructions perfectly. Its rules are:
- Both groups have a bell-curve (normal) shape
- Both groups have about the same spread (similar standard deviation)
- Group sizes are roughly equal
If those rules are broken, the results can mislead you.
2. Enter Welch's t-Test
Welch's t-test is like a more flexible version of the recipe. It doesn't panic if one group has a much wider spread than the other, or if one group has way more students.
That makes Welch's test a better everyday choice. In fact, many modern stats programs use Welch's test as the default.
3. The Formula (But Don't Worry)
The math looks a little scary:
In simple terms:
- Take the difference between the two averages (numerator)
- Divide it by how "uncertain" we are about that difference (denominator)
- Bigger differences relative to uncertainty → bigger t-value → more evidence that the groups differ
Welch's test also has a trick called the Satterthwaite approximation that adjusts how many "degrees of freedom" we have. Think of this as fine-tuning how strict the test should be, based on uneven group sizes.
4. Step-by-Step Example (No Fear!)
Two classes take the same test:
Class A: average score = 80, spread (SD) = 10, size = 25 students
Class B: average score = 85, spread (SD) = 20, size = 30 students
👉 Notice: Class B not only scored higher, but also has more variation in scores.
Running Welch's test:
- The difference in averages is 5 points
- But because Class B has a much bigger spread, the test says the difference is not statistically significant (p ≈ 0.22)
In plain English: "The difference could just be due to chance — we don't have enough proof that Class B is truly better."
5. When Should You Use Welch's Test?
Use Welch's t-test when:
- The two groups don't have similar spreads (one is more variable)
- The group sizes are unequal
- You just want a test that is more forgiving when real-world data isn't perfect
💡 Quick tip: If you're ever unsure which test to pick, Welch's test is almost always the safer choice.
6. Common Misunderstandings
Myth 1: "Welch's test is harder or less accurate."
Reality: Nope. It's just a small tweak on the original t-test and usually more accurate.
Myth 2: "The Student's t-test is always the standard."
Reality: It used to be taught first, but today Welch's is often the recommended default.
7. Hands-On: Try It Yourself
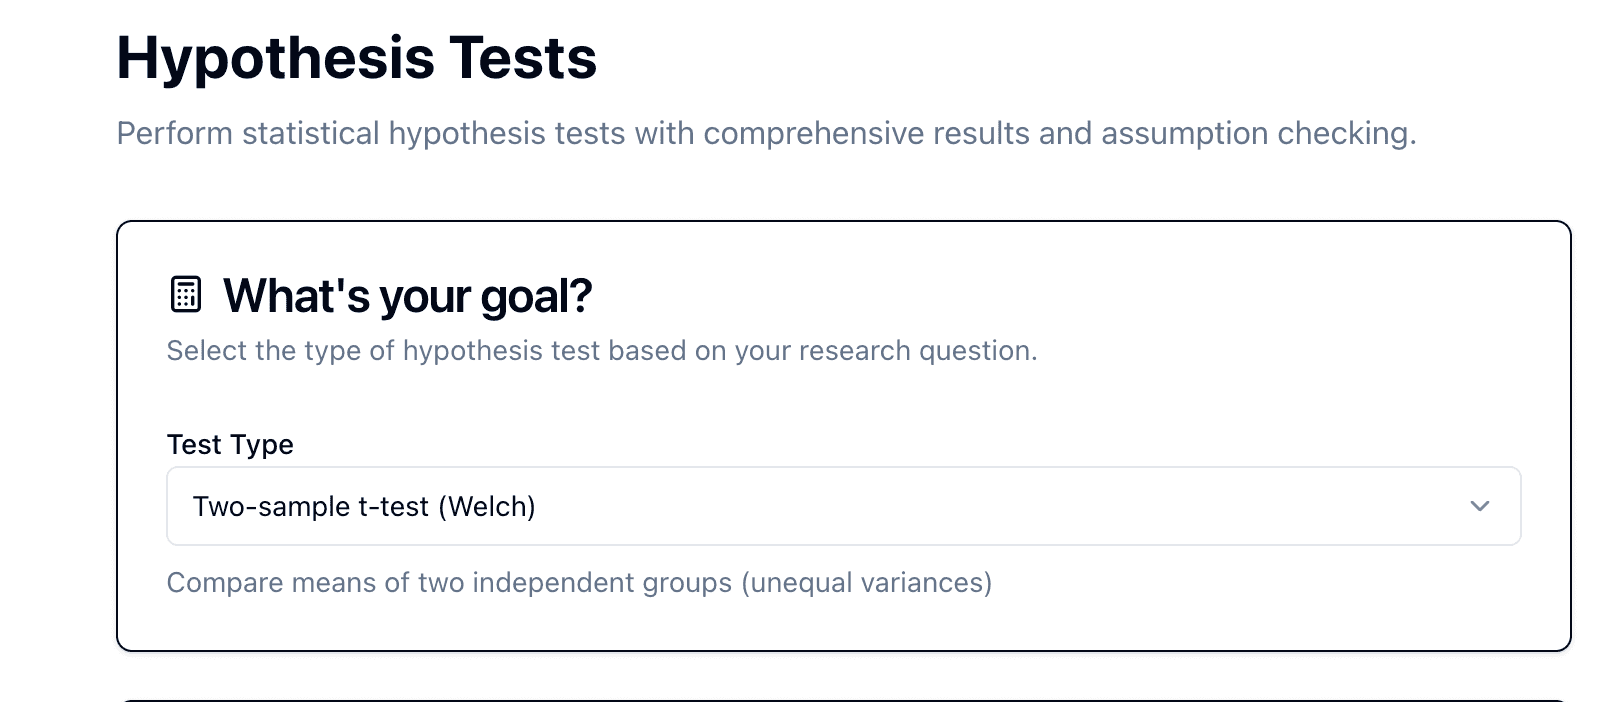
Ready to run your own Welch's t-test? Let's use our Hypothesis Testing Calculator with real data.
7.1. Sample Dataset for Testing
📥 Download Your Practice Data
📊 Data Preview
score
18.34
19.84
21.56
22.85
23.71
24.57
25.00
25.43
26.29
27.15
...and 15 more rows
7.2. Step-by-Step Instructions
Step 1: Visit our Hypothesis Testing Calculator

Step 2: Upload your CSV file

Step 3: Choose your data file

Step 4: Select your variables

Step 5: Review the test results

Step 6: Check statistical assumptions

Expected Results:
- Test Statistic (t): ~-2.22
- P-value: ~0.029
- 95% Confidence Interval: [-5.60, -0.30]
- Interpretation: Significant difference at α = 0.05 (Group B scores higher than Group A)
8. Why It Matters
Choosing the right test isn't just about math — it's about avoiding false confidence. Using Student's test when spreads are unequal is like comparing apples to oranges. Welch's test puts them on fair ground.
Wrap-Up: Welch's t-test is a friendly upgrade to the classic t-test. It helps you compare group averages even when the groups are uneven or "messy."
👉 Want to try it without crunching formulas? Use our Hypothesis Testing Calculator — just plug in your numbers and see the results instantly.